
Fishen
The 2026 market for 5 Axis Vertical Machining Center equipment is becoming more competitive and more selective. Manufacturers now compare accuracy, spindle performance, automation, software, service coverage, and lifecycle cost. A glossy machine still means little if it loses stability during a deep cavity cut.
Market estimates show continued expansion. Grand View Research projects steady growth in the global CNC machine tools market through 2030, supported by aerospace, medical, automotive, and energy manufacturing. Fortune Business Insights also identifies automation and complex-component production as major growth drivers in advanced machining. However, these reports use different definitions and measurement methods. Their figures should not be treated as perfectly comparable.
Tony Schmitz, a respected machining dynamics researcher at the University of Tennessee, has emphasized, “Process understanding is essential for successful machining.” That principle matters when comparing suppliers. A five-axis machine must control vibration, tool engagement, thermal drift, and collision risk under real cutting conditions. Marketing brochures rarely show those details.
This guide examines five leading suppliers expected to influence the 2026 market. The evaluation considers machine architecture, simultaneous five-axis capability, control technology, integration options, global support, and demonstrated industry experience. It also considers practical weaknesses. Some suppliers offer excellent precision but expensive ownership. Others provide strong automation but limited local service. The ranking is useful, not absolute. Buyers should verify test-cut results, installed references, and after-sales response before making a final decision.
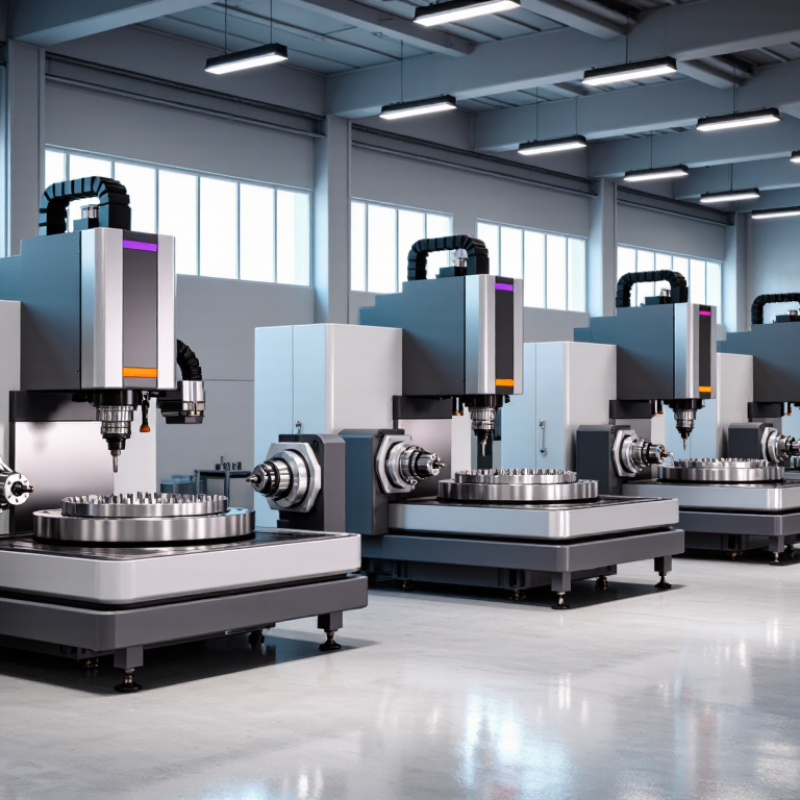
Five-axis VMC performance begins with kinematics, not brochures. A B-axis tilts the spindle, while a C-axis rotates the table or workpiece. Their combined motion controls tool orientation around complex surfaces. Small pivot-point errors can leave visible marks on turbine blades or medical components. ISO 230-2:2014 defines tests for positioning accuracy and repeatability. It does not promise one universal tolerance.
A reliable acceptance test should record each linear and rotary axis separately. It should also examine combined B/C motion near the working envelope. Laser interferometry can expose linear positioning errors. Ball-bar testing can reveal circular interpolation problems. Thermal drift matters too. A cold machine may pass inspection, then shift after two hours. That detail is often missed. The 2024 Global Machine Tool Outlook reported continued demand for higher automation and more complex machining capacity. This trend makes five-axis accuracy increasingly commercial, not merely technical.
Supplier comparisons should include calibration records, volumetric compensation, probing routines, and service response data. Ask for ISO 230-2 results from the actual machine configuration. Do not rely only on factory averages. A 2024 industry analysis by Grand View Research estimated sustained growth in the global CNC machine-tool market through 2030, driven partly by precision manufacturing. The number sounds encouraging, but market growth does not guarantee geometric accuracy. Kinematic testing remains essential. A perfect-looking report can still mislead. Probe the details.
The 2026 ranking of five-axis vertical machining center suppliers should begin with measurable evidence. Market share shows competitive reach across regions and industry segments. However, shipment volume alone can distort the picture. A supplier may report strong sales in one year because of a large contract. Reliable comparisons should use three-year averages and verified production data.
Revenue adds financial depth to the ranking. It reflects product value, service income, and customer demand. Analysts should separate machining center revenue from unrelated business lines. Currency changes also need careful adjustment. Numbers need context. Audited filings, distributor records, and customer interviews can improve accuracy, although public data remains incomplete.
Installed base reveals practical experience in the field. A large population of operating machines suggests proven deployment, technician coverage, and spare-parts readiness. Site visits can confirm whether machines remain productive after several years. Service response times, software support, and documented uptime should influence the score. Still, installed base may favor older suppliers, even when newer systems perform better. That weakness deserves review.
A balanced model could assign equal weight to market share, revenue, and installed base. Additional checks should examine regional balance, machine utilization, and customer retention. Experts should publish definitions, data periods, and calculation methods. Without that transparency, a ranking can look precise while hiding assumptions. Performance data should be updated annually as demand, technology, and factory investment change.
For 2026, five-axis buyers should compare spindle speed with tested accuracy. The target range is 10,000–30,000 rpm. Speed is not everything. High rpm supports small tools, aluminum, and medical-grade finishing. However, thermal growth can move the tool centerline during long cycles. ISO 230-2:2014 recommends checking positioning accuracy under defined test conditions. Therefore, a quoted ±0.005 mm figure needs temperature, axis travel, and measurement details.
Fortune Business Insights’ 2024 CNC machine tools report values the global market at approximately USD 88.7 billion in 2024. It also projects a 6.3% compound annual growth rate through 2032.
Mordor Intelligence reports continued demand for multi-axis equipment, driven by aerospace, automotive, and complex mold production. These figures support stronger supplier competition, but they do not prove cutting performance.
A 30,000 rpm spindle may still underperform with poor balancing or weak thermal compensation.
Experienced buyers should request a sample part, spindle runout data, and a five-axis volumetric test. Ask whether ±0.005 mm means positioning, repeatability, or finished-part tolerance. That distinction matters. Heat changes geometry. Probe calibration, coolant temperature, and fixture stiffness also influence results. I would score each supplier across spindle stability, simultaneous-motion accuracy, service response, and documented test methods. The comparison remains imperfect because factory data rarely reflects a humid shop floor, worn tooling, or an eight-hour production cycle. Real cutting trials deserve more weight than attractive specification sheets.
2026 Top 5 Axis Vertical Machining Center Suppliers?
Automation Benchmark: Tool Capacity, Chip-to-Chip Time, and Machine Uptime
A serious five-axis comparison needs more than spindle speed. Tool capacity affects unattended hours, while chip-to-chip time controls repeated cycle losses. A two-second saving, repeated 800 times daily, removes about 27 minutes from production. That is not theoretical. It appears beside the operator.
Deloitte’s 2024 Smart Manufacturing Survey found that 86% of manufacturing leaders expect smart manufacturing to become a primary competitiveness driver within five years. The International Federation of Robotics reported 541,302 industrial robots installed globally in 2023. These figures support automation investment, but they do not prove machining performance. Buyers should request measured cycle data, tool-change counts, and uptime records from comparable materials.
Tips: Ask for a 30-day uptime definition. Separate mechanical availability from scheduled maintenance. Check whether chip-to-chip time includes tool selection, spindle orientation, and door movement. A large magazine is useful, yet oversized tooling can reduce usable capacity. I have seen attractive specifications fail on the shop floor. Coolant alarms, chip packing, and tool-search delays were ignored. That mistake is easy to repeat. Use ISO 22400-style KPI definitions, and demand logged evidence rather than showroom claims.
| Anonymous Supplier Group | Typical Tool Capacity (tools) |
Chip-to-Chip Time (seconds) |
Rapid Traverse (m/min) |
Spindle Speed Range (rpm) |
Target Machine Uptime (% of scheduled time) |
Automation Readiness |
|---|---|---|---|---|---|---|
| Supplier Group A | 30–40 | 5.5 | 36 | 12,000–20,000 | 92% | High |
| Supplier Group B | 40–60 | 4.8 | 42 | 15,000–24,000 | 94% | Very High |
| Supplier Group C | 24–32 | 6.0 | 30 | 10,000–18,000 | 91% | Medium–High |
| Supplier Group D | 48–60 | 4.2 | 48 | 18,000–25,000 | 95% | Very High |
| Supplier Group E | 30–48 | 5.0 | 40 | 12,000–22,000 | 93% | High |
Ownership metrics reveal more than spindle speed or table size. A practical comparison should calculate total cost of ownership across ten years. Include purchase price, tooling, coolant, maintenance, software, training, and disposal. A machine running 4,000 hours annually may consume thousands of kilowatt-hours. Energy data must come from measured production cycles, not laboratory claims.
Service coverage can decide whether a profitable cell becomes an idle asset. Check technician response times, local spare-parts inventory, remote diagnostics, and preventive-maintenance schedules. Ask for service records from comparable installations. One delayed encoder or spindle repair can disrupt delivery commitments. Promised coverage is not proven coverage. Verify it.
ROI calculations should use realistic utilization, material costs, labor rates, and financing terms. A payback period under three years may look attractive, but unstable demand can change the result quickly. My own evaluation spreadsheets once overlooked operator training and coolant disposal. The forecast looked precise, but it was incomplete. Include sensitivity cases for 60%, 80%, and 95% utilization. The best supplier is not always the cheapest. It is the one delivering predictable output, controllable ownership costs, and dependable support throughout the machine’s working life.
Use three-year averages, verified production data, and regional market share. One large contract can distort annual shipment figures.
Revenue should reflect machining centers, service, and related support. Unrelated products can make a supplier appear stronger than it is.
A large installed base suggests field experience, technician coverage, and spare-parts readiness. Older equipment can still inflate this measure.
Request response-time records, software support details, spare-parts coverage, and documented uptime. Site visits can reveal whether older machines remain productive.
No. Speed is not everything. High rpm helps small tools and fine finishing, but poor balancing or heat control can reduce performance.
Ask whether it describes positioning, repeatability, or finished-part tolerance. Temperature, axis travel, fixture stiffness, and probe calibration can change results.
Request measured cycle times, tool-change counts, magazine capacity, and logged uptime. A two-second saving repeated 800 times saves about 27 minutes daily.
Use a fixed period, such as 30 days. Separate mechanical availability from scheduled maintenance, alarms, chip packing, and tool-search delays.
Real cutting trials matter more. Humidity, worn tools, coolant temperature, and an eight-hour production cycle may expose hidden weaknesses.
Yes. Equal weighting of market share, revenue, and installed base improves clarity, but newer systems may perform better than older fleets. The model still has gaps.
This guide evaluates the 2026 top five 5 Axis Vertical Machining Center suppliers through practical performance and ownership criteria. It explains essential machine fundamentals, including ISO 230-2 positioning accuracy, repeatability, and B/C-axis kinematics, while comparing supplier strength through market share, revenue, installed base, and long-term industry presence. The review focuses on machines equipped with 10,000–30,000 rpm spindles and target accuracy of approximately ±0.005 mm, helping manufacturers understand how these specifications affect precision, productivity, and application suitability.
Automation and operating efficiency are also central to the comparison. Tool capacity, chip-to-chip time, machine uptime, and automation readiness are assessed alongside total cost of ownership, energy consumption, service coverage, maintenance requirements, and expected ROI period. By combining technical capability with lifecycle economics, the article offers a balanced framework for selecting a reliable five-axis machining solution for demanding production environments.